Activity Log — Verify Every Trade
The Activity Log records every trade TVH processes for you, with the outcome the exchange returned. It is the source of truth for whether a signal actually executed.
- A
200 OKfrom the webhook means "signal accepted", not "trade executed". The real result is here. - Every row has a Type (Info, Warning, Error, Trailing Info, Command) and a Message carrying the exchange's own text.
- Filter any column with the funnel icon; sort by clicking a column header.
- To see the exact JSON that triggered a trade, enable the Command type in the Type filter.
Open it any time at Account → Activity Log.
What it shows
Each row is one event, newest first, across all your exchanges and API keys:
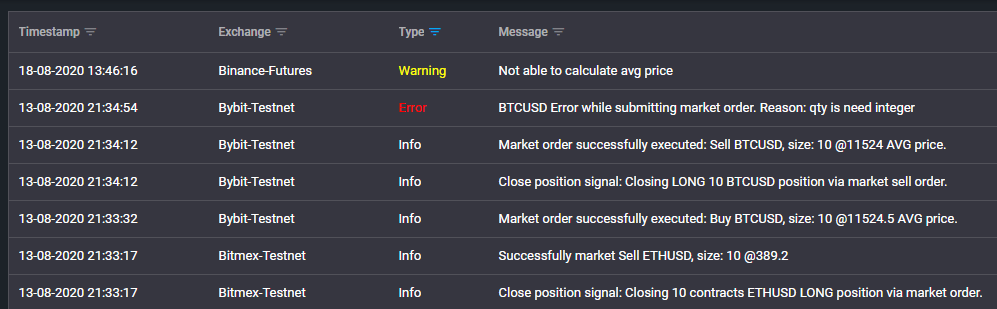
| Column | What it holds |
|---|---|
| Timestamp | When TVH processed the event (UTC). |
| Exchange | Which exchange/identifier the event belongs to. |
| Type | The severity/category — see below. |
| Message | Human-readable detail, including the exchange's own response (fill price, size, or the raw error). |
Type values:
- Info — a normal step succeeded (order submitted, position closed, signal received).
- Warning (yellow) — the trade ran but something needed attention, e.g.
Not able to calculate avg price. - Error (red) — the exchange rejected the order. The message carries the exchange's reason, e.g.
BTCUSD Error while submitting market order. Reason: qty is need integer. - Trailing Info — trailing-stop updates as price moves.
- Command — the raw trade command that triggered the trade (hidden by default, see below).
This is why a non-trivial signal is never "done" at the HTTP response: an order can return 200 OK at the webhook and still fail at the exchange. The Error/Warning row here is the authoritative result.
Filtering
Every column header has a small funnel icon. Click it to filter that column.
For example, the Exchange filter opens a checkbox list — tick the exchanges you want to see and click OK:

The Type filter works the same way — tick the entry types you want to see and click OK.
See the exact trade command
When you are debugging, it helps to see the precise payload that produced a trade. Open the Type filter and tick Command — it is unchecked by default, so the raw command rows stay out of your way until you ask for them:

A Command row then appears next to the trade, showing the full TradeCommand JSON TVH received:
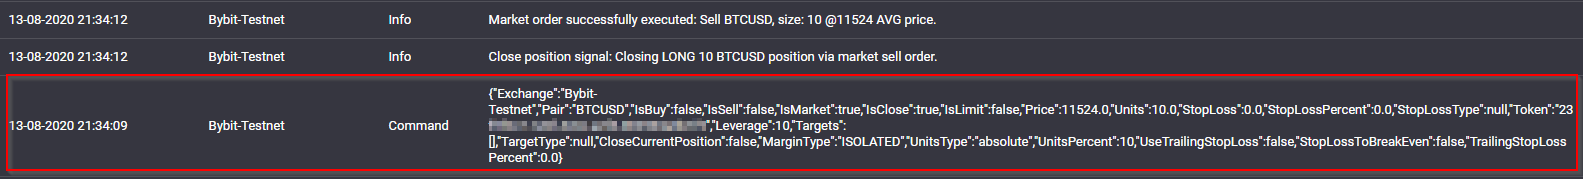
Compare this against what you intended to send — a mismatch (wrong Pair, missing sizing, wrong apiKey) points straight at the typo. See Debug a Failed Alert for the full diagnosis flow.
The Command entry includes your Token. Redact it before sharing a screenshot — the last 4 characters are enough for support to find your account.
Sorting
Click any column header to sort by it; click again to flip the direction. An arrow next to the header shows the current direction:

Get the same log in Telegram
If you activate the Telegram bot, every event TVH writes to the Activity Log is also pushed to your Telegram chat in real time — the same execution confirmations, warnings, and errors, for trades fired by any integration (TradingView webhook, Chrome Extension, Telegram forward, or a copy-trading broadcast). It is the quickest way to watch results without keeping the dashboard open. See Telegram Bot Setup.
Where this fits
- After a test trade, the Activity Log confirms the fill — see Test a Trade.
- When a trade does not behave as expected, start here — see Debug a Failed Alert.
- Before going live, use it to verify your demo trades executed cleanly — see Before You Go Live.